Grafana Prometheus
Preparing
- install helm, the package manager for Kubernetes
curl -fsSL -o get_helm.sh https://raw.githubusercontent.com/helm/helm/main/scripts/get-helm-3
chmod 700 get_helm.sh
./get_helm.sh
➜  homelab git:(master) ✗ ./get_helm.sh
Downloading https://get.helm.sh/helm-v3.17.0-linux-amd64.tar.gz
Verifying checksum... Done.
Preparing to install helm into /usr/local/bin
helm installed into /usr/local/bin/helm
Prometheus
- get Helm Repo info
helm repo add prometheus-community https://prometheus-community.github.io/helm-charts
#  "prometheus-community" has been added to your repositories

helm repo update
# Hang tight while we grab the latest from your chart repositories...
# ...Successfully got an update from the "prometheus-community" chart repository
# Update Complete. ⎈Happy Helming!⎈
see helm repo for command documentation.
- install Helm Chart
helm install prometheus-stack prometheus-community/kube-prometheus-stack --namespace=prometheus-stack --create-namespace
[!NOTE] it will take a little while for pulling all the images and deploy the stack.
we get this logs
NAME: prometheus-stack
LAST DEPLOYED: Sun Feb  9 15:21:28 2025
NAMESPACE: prometheus-stack
STATUS: deployed
REVISION: 1
NOTES:
kube-prometheus-stack has been installed. Check its status by running:
  kubectl --namespace prometheus-stack get pods -l "release=prometheus-stack"

Get Grafana 'admin' user password by running:

  kubectl --namespace prometheus-stack get secrets prometheus-stack-grafana -o jsonpath="{.data.admin-password}" | base64 -d ; echo

Access Grafana local instance:

  export POD_NAME=$(kubectl --namespace prometheus-stack get pod -l "app.kubernetes.io/name=grafana,app.kubernetes.io/instance=prometheus-stack" -oname)
  kubectl --namespace prometheus-stack port-forward $POD_NAME 3000

Visit https://github.com/prometheus-operator/kube-prometheus for instructions on how to create & configure Alertmanager and Prometheus instances using the Operator.
check the pods
➜  homelab git:(master) ✗ k get pods -A
NAMESPACE          NAME                                                     READY   STATUS      RESTARTS   AGE
kube-system        coredns-ccb96694c-nfrc2                                  1/1     Running     0          3d16h
kube-system        helm-install-traefik-crd-crhbv                           0/1     Completed   0          3d16h
kube-system        helm-install-traefik-xgfhp                               0/1     Completed   1          3d16h
kube-system        local-path-provisioner-5cf85fd84d-qhh75                  1/1     Running     0          3d16h
kube-system        metrics-server-5985cbc9d7-bkj84                          1/1     Running     0          3d16h
kube-system        svclb-traefik-96f1ad5e-6qm9c                             2/2     Running     0          3d16h
kube-system        traefik-5d45fc8cc9-q92qs                                 1/1     Running     0          3d16h
prometheus-stack   alertmanager-prometheus-stack-kube-prom-alertmanager-0   2/2     Running     0          2m26s
prometheus-stack   prometheus-prometheus-stack-kube-prom-prometheus-0       2/2     Running     0          2m24s
prometheus-stack   prometheus-stack-grafana-7844ccdbcc-x8v5x                3/3     Running     0          2m39s
prometheus-stack   prometheus-stack-kube-prom-operator-56b7b87469-wq72b     1/1     Running     0          2m39s
prometheus-stack   prometheus-stack-kube-state-metrics-68c4998c7c-plnvw     1/1     Running     0          2m39s
prometheus-stack   prometheus-stack-prometheus-node-exporter-nq62g          1/1     Running     0          2m40s
all pods running , good, also shows in k9s
check services, but couldn’t find corresponding port-forward for webs
➜  homelab git:(master) ✗ k get svc
NAME         TYPE        CLUSTER-IP   EXTERNAL-IP   PORT(S)   AGE
kubernetes   ClusterIP   10.43.0.1    <none>        443/TCP   3d16h
- Verify Services in the
prometheus-stacknamespace:
➜  homelab git:(master) ✗ k get svc -n prometheus-stack
NAME                                        TYPE        CLUSTER-IP      EXTERNAL-IP   PORT(S)                      AGE
alertmanager-operated                       ClusterIP   None            <none>        9093/TCP,9094/TCP,9094/UDP   20m
prometheus-operated                         ClusterIP   None            <none>        9090/TCP                     20m
prometheus-stack-grafana                    ClusterIP   10.43.125.73    <none>        80/TCP                       21m
prometheus-stack-kube-prom-alertmanager     ClusterIP   10.43.187.60    <none>        9093/TCP,8080/TCP            21m
prometheus-stack-kube-prom-operator         ClusterIP   10.43.206.139   <none>        443/TCP                      21m
prometheus-stack-kube-prom-prometheus       ClusterIP   10.43.147.195   <none>        9090/TCP,8080/TCP            21m
prometheus-stack-kube-state-metrics         ClusterIP   10.43.127.173   <none>        8080/TCP                     21m
prometheus-stack-prometheus-node-exporter   ClusterIP   10.43.61.250    <none>        9100/TCP                     21m
- In order to access grafana and prometheus, need to configure port forwading to expose services externally
Since you are running K3s on a single Azure VM (74.235.202.213), and you want to expose Prometheus and Grafana externally, follow these steps:
🔹 Step 1: Check the Current Service Types
Since you’re running K3s on a single VM, the default service type is ClusterIP, which means services are only accessible inside the cluster.
Since both services are ClusterIP, they are not accessible externally. We need to change this.
🔹 Step 2: Change the Service Type to NodePort
We need to expose the services on the VM’s public IP.
Run these commands to modify the service types:
kubectl patch svc prometheus-stack-grafana -n prometheus-stack -p '{"spec": {"type": "NodePort"}}'
# service/prometheus-stack-grafana patched

kubectl patch svc prometheus-stack-kube-prom-prometheus -n prometheus-stack -p '{"spec": {"type": "NodePort"}}'
# service/prometheus-stack-kube-prom-prometheus patched
Now, check the new ports assigned:
➜  homelab git:(master) ✗ k get svc -n prometheus-stack | grep -E "(grafana|kube-prom)"
prometheus-stack-grafana                    NodePort    10.43.125.73    <none>        80:32749/TCP                    86m
prometheus-stack-kube-prom-alertmanager     ClusterIP   10.43.187.60    <none>        9093/TCP,8080/TCP               86m
prometheus-stack-kube-prom-operator         ClusterIP   10.43.206.139   <none>        443/TCP                         86m
prometheus-stack-kube-prom-prometheus       NodePort    10.43.147.195   <none>        9090:32373/TCP,8080:31385/TCP   86m
Grafana: accessible on 74.235.202.213:32749Prometheus: accessible on 74.235.202.213:32373
but we couldn’t access them yet, we need to open the ports in Azure Firewall
🔹 Step 3: Open the Ports in Azure Firewall
Your Azure VM has an NSG (Network Security Group) that blocks external traffic by default.
You need to allow incoming connections on these ports.
✅ Open NodePorts in Azure Portal
- Go to Azure Portal
- Navigate to: Virtual Machines → Your VM (
74.235.202.213) - Go to: Networking
- Click: “Add inbound port rule”
- Source: Any
- Protocol: TCP
- Destination Port range: 32749, 32373 (Grafana & Prometheus ports)
- Action: Allow
- Priority: Keep default
- Name:
Allow-Grafana-Prometheus
- Click “Save”
💡 Key Takeaway:
- Source Port Range refers to the port on the client machine (browser or CLI).
- You do NOT need to specify this (leave it
Anyor*).
- You do NOT need to specify this (leave it
- Destination Port Range refers to the port on your Azure VM (the NodePorts).
- You MUST specify this to allow external access.
Now, you should be able to access:
- Grafana:
http://74.235.202.213:32749
- Prometheus:
http://74.235.202.213:32373
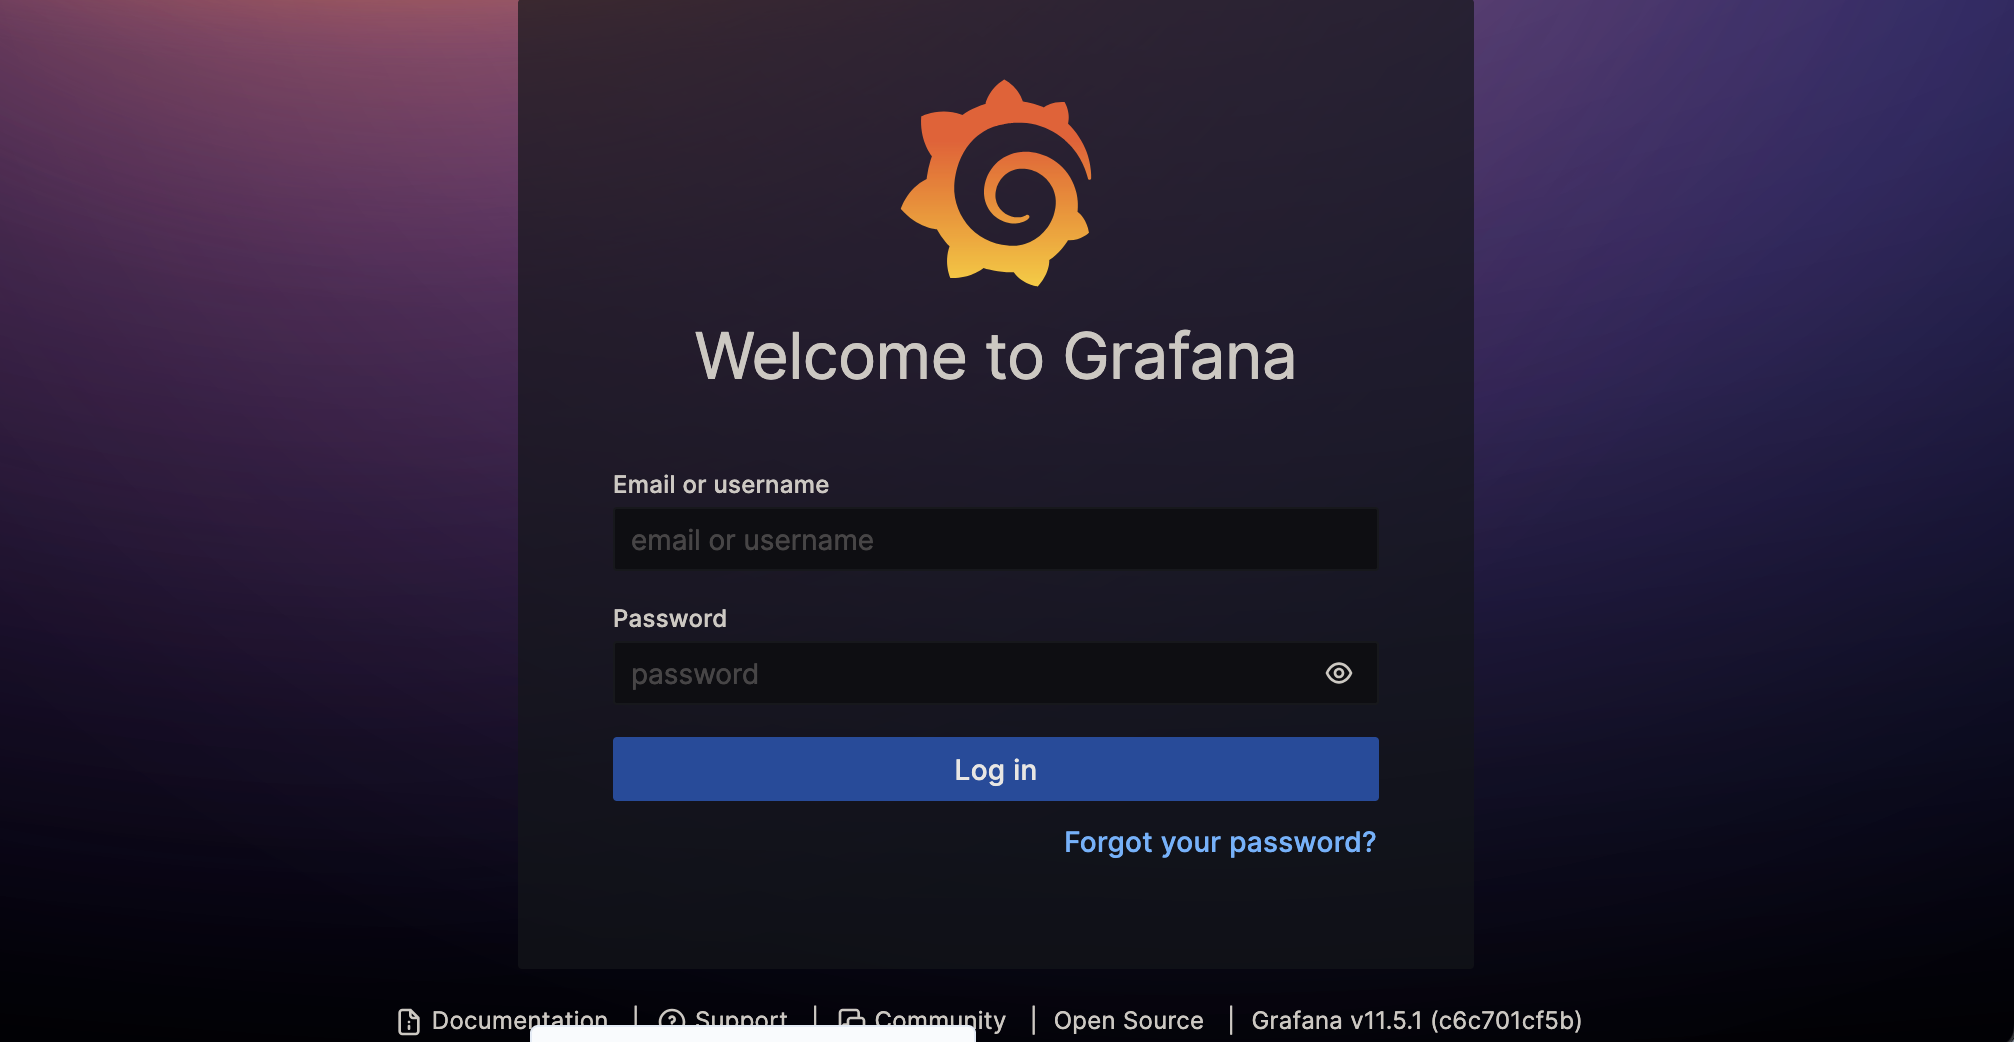
🔹 Step 3: Access Grafana & Prometheus
Once the firewall rules are applied, you should be able to access the services using your browser:
- Grafana: 👉
http://74.235.202.213:32749 - Prometheus: 👉
http://74.235.202.213:32373
If you get connection timeouts, wait a few minutes and double-check:
kubectl get svc -n prometheus-stack | grep -E "(grafana|kube-prom)"
Also, make sure the ports are actually open using:
nc -zv 74.235.202.213 32749  # Check Grafana
nc -zv 74.235.202.213 32373  # Check Prometheus
Congragulations, now you’ve install the Grafana, Prometheus on your cluster and ready to go! 💃
Change the password for Grafana and Prometheus
- retrieve current admin password for Grafana
kubectl --namespace prometheus-stack get secrets prometheus-stack-grafana -o jsonpath="{.data.admin-password}" | base64 -d ; echo
we get the default password for Grafana: prom-operator
- By default, Prometheus does not enforce authentication, meaning it doesn’t require a username or password to access its web interface.
To manually change Grafana’s password, you need to log in to the Grafana pod and use the grafana-cli tool.
kubectl exec -it -n prometheus-stack $(kubectl get pod -n prometheus-stack -l "app.kubernetes.io/name=grafana" -o jsonpath="{.items[0].metadata.name}") -- grafana-cli admin reset-admin-password NEW_PASSWORD
Replace NEW_PASSWORD with your desired password.
You will get something like this:
Deprecation warning: The standalone 'grafana-cli' program is deprecated and will be removed in the future. Please update all uses of 'grafana-cli' to 'grafana cli'
INFO [02-09|18:24:36] Starting Grafana                         logger=settings version=11.5.1 commit=cf5be984b088b9d51690b474ab63ca86ff branch=HEAD compiled=2025-02-09T18:24:36Z
INFO [02-09|18:24:36] Config loaded from                       logger=settings file=/usr/share/grafana/conf/defaults.ini
INFO [02-09|18:24:36] Config overridden from Environment variable logger=settings var="GF_PATHS_DATA=/var/lib/grafana/"
INFO [02-09|18:24:36] Config overridden from Environment variable logger=settings var="GF_PATHS_LOGS=/var/log/grafana"
INFO [02-09|18:24:36] Config overridden from Environment variable logger=settings var="GF_PATHS_PLUGINS=/var/lib/grafana/plugins"
INFO [02-09|18:24:36] Config overridden from Environment variable logger=settings var="GF_PATHS_PROVISIONING=/etc/grafana/provisioning"
INFO [02-09|18:24:36] Config overridden from Environment variable logger=settings var="GF_SECURITY_ADMIN_USER=admin"
INFO [02-09|18:24:36] Config overridden from Environment variable logger=settings var="GF_SECURITY_ADMIN_PASSWORD=*********"
INFO [02-09|18:24:36] Target                                   logger=settings target=[all]
INFO [02-09|18:24:36] Path Home                                logger=settings path=/usr/share/grafana
INFO [02-09|18:24:36] Path Data                                logger=settings path=/var/lib/grafana/
INFO [02-09|18:24:36] Path Logs                                logger=settings path=/var/log/grafana
INFO [02-09|18:24:36] Path Plugins                             logger=settings path=/var/lib/grafana/plugins
INFO [02-09|18:24:36] Path Provisioning                        logger=settings path=/etc/grafana/provisioning
INFO [02-09|18:24:36] App mode production                      logger=settings
INFO [02-09|18:24:36] FeatureToggles                           logger=featuremgmt reportingUseRawTimeRange=true alertingNoDataErrorExecution=true pinNavItems=true userStorageAPI=true lokiQueryHints=true dataplaneFrontendFallback=true accessControlOnCall=true publicDashboardsScene=true lokiStructuredMetadata=true angularDeprecationUI=true dashgpt=true openSearchBackendFlowEnabled=true annotationPermissionUpdate=true managedPluginsInstall=true formatString=true panelMonitoring=true newFiltersUI=true lokiQuerySplitting=true lokiLabelNamesQueryApi=true transformationsVariableSupport=true groupToNestedTableTransformation=true transformationsRedesign=true azureMonitorEnableUserAuth=true recordedQueriesMulti=true newDashboardSharingComponent=true addFieldFromCalculationStatFunctions=true alertingApiServer=true logsContextDatasourceUi=true cloudWatchCrossAccountQuerying=true alertingUIOptimizeReducer=true onPremToCloudMigrations=true prometheusAzureOverrideAudience=true correlations=true logsExploreTableVisualisation=true dashboardSceneForViewers=true ssoSettingsApi=true useSessionStorageForRedirection=true recoveryThreshold=true cloudWatchRoundUpEndTime=true dashboardSceneSolo=true dashboardScene=true tlsMemcached=true logsInfiniteScrolling=true influxdbBackendMigration=true promQLScope=true kubernetesPlaylists=true accessActionSets=true newPDFRendering=true zipkinBackendMigration=true awsAsyncQueryCaching=true preinstallAutoUpdate=true nestedFolders=true unifiedRequestLog=true alertingSimplifiedRouting=true logRowsPopoverMenu=true cloudWatchNewLabelParsing=true alertingInsights=true exploreMetrics=true
INFO [02-09|18:24:36] Connecting to DB                         logger=sqlstore dbtype=sqlite3
INFO [02-09|18:24:36] Locking database                         logger=migrator
INFO [02-09|18:24:36] Starting DB migrations                   logger=migrator
INFO [02-09|18:24:36] migrations completed                     logger=migrator performed=0 skipped=629 duration=1.843411ms
INFO [02-09|18:24:36] Unlocking database                       logger=migrator
INFO [02-09|18:24:36] Envelope encryption state                logger=secrets enabled=true current provider=secretKey.v1

Admin password changed successfully ✔
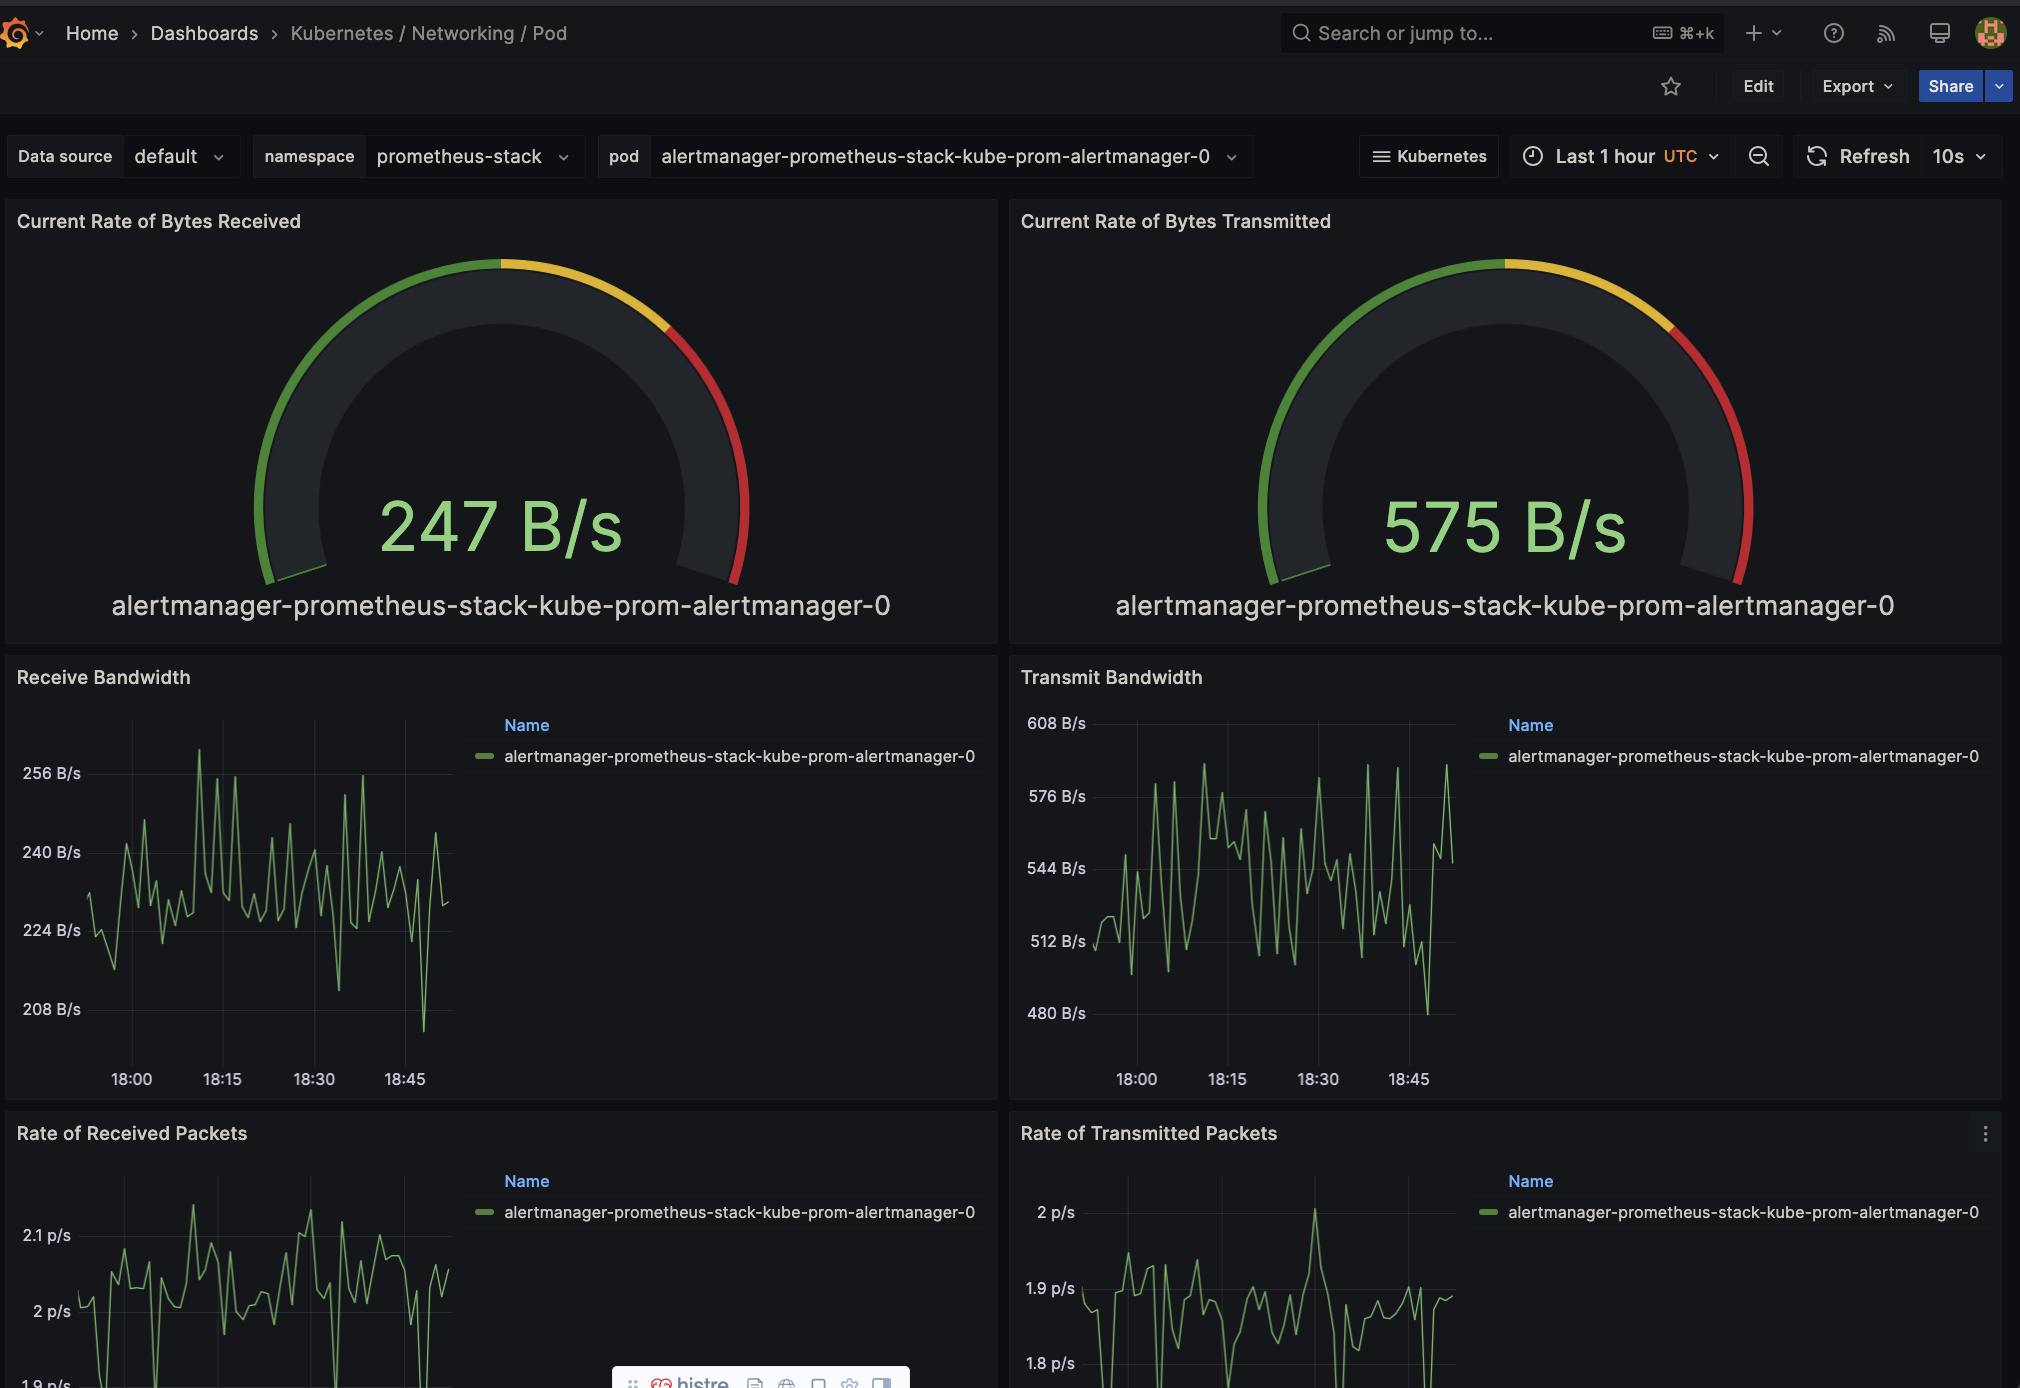
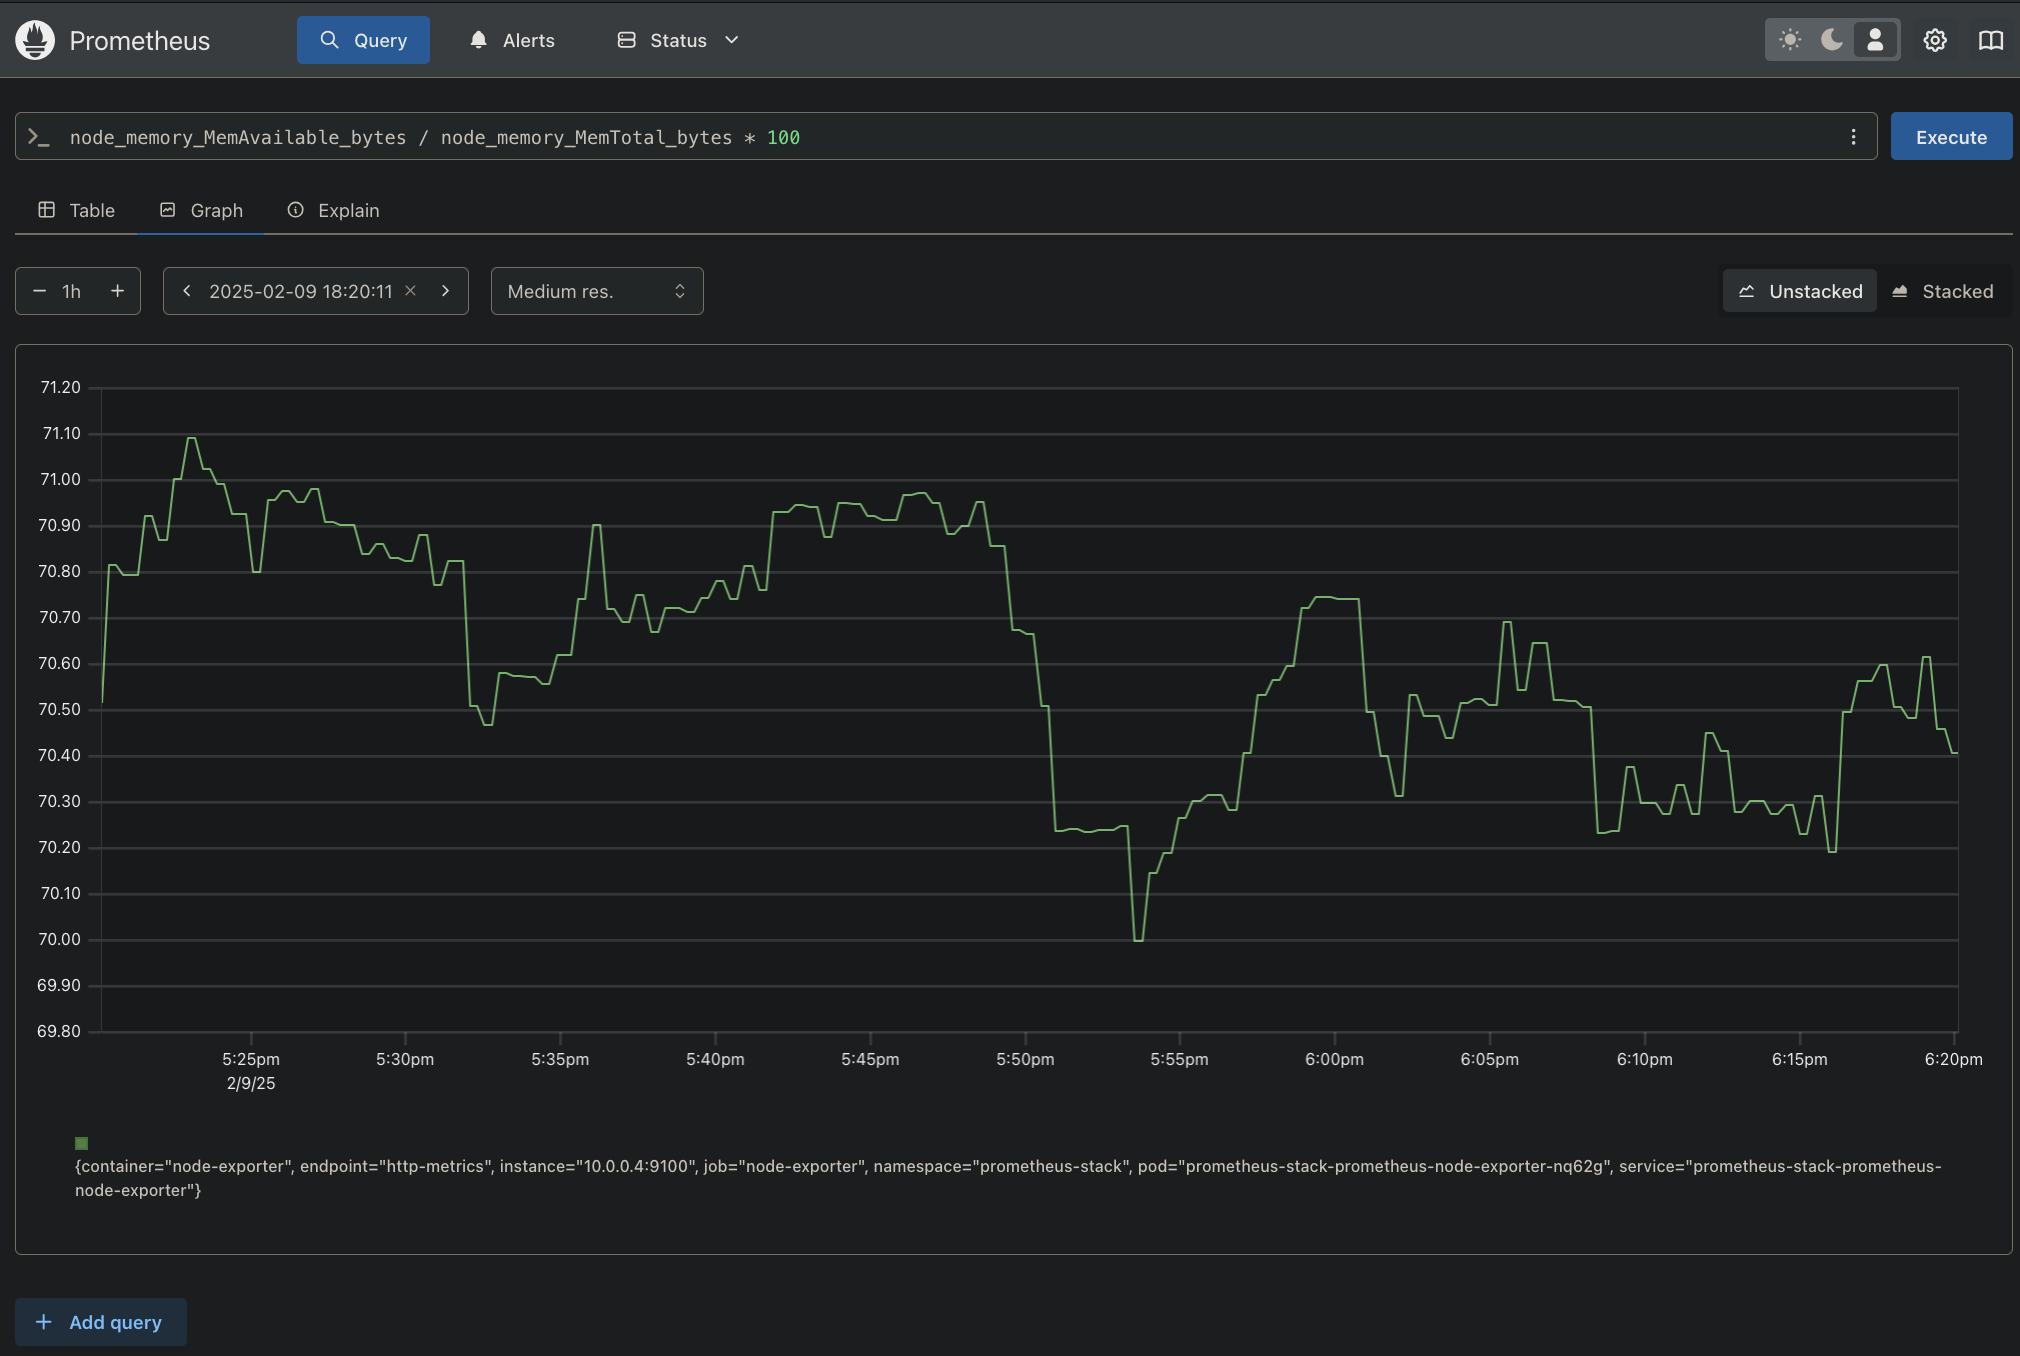
They have some default dashboard and trace options, here are the examples: